
Stay DRY with PostSharp: Profile ASP.NET MVC application using MiniProfiler
Feb 23, 2015
There are so many productive tools and packages out there that can be used for profiling an ASP.NET MVC application. While back I wrote a quick intro about how Glimpse can come handy profiling your web application.
There is one more simplistic and quick way to start profiling load / execution time for your application routines using MiniProfiler. This little package is prepared by folks at Stackexchange and used for Stackoverflow.com and other sites.
MiniProfile's homepage shows quick way to get started with using MiniProfiler in your application. Following code snippet is required to profile a piece of code (not to forget MiniProfiler.Start() and MiniProfiler.Stop()):
var profiler = MiniProfiler.Current;
using (profiler.Step("Set page title"))
{
    // Your code to profile
}
and you will see something similar to following when you load your application and run through profiled piece of code:
{<1>}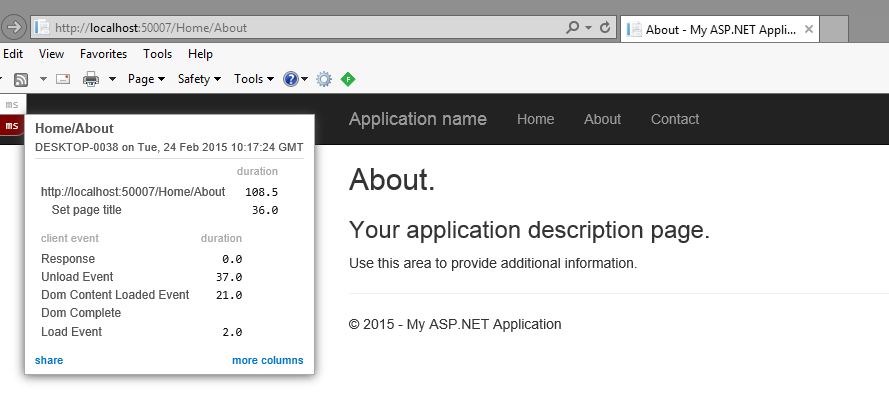
So if I need to profile the execution time taken for any / all controller actions of my application I need to wrap the block of code in my Action method of controller inside using (profiler.Step("Your step name")).
I need to wrap a code block as MiniProfiler.Step to profile it
is the part where AOP can come handy.
PostSharp is a rich set of ready-made Aspects to use out-of-the-box and also extensible framework to create your own custom Aspects to write business centric, clean and more maintainable code. It will help you stay DRY (Don't repeat yourself) for the profiling part and also for other possible Aspects for your application.
This case scenario can be taken as simplistic example how PostSharp can help you achieve profiling in a cleaner and maintainable way!!
To wrap controller's Action method for profiling you can create a custom Aspect Attribute using OnMethodBoundaryAspect. The two main overridable methods were are interested for this example are OnEntry(MethodExecutionArgs args) and OnExit(MethodExecutionArgs args). Code of this methods executes when the execution starts / stops for a particular method on which this Aspect is applied.
Basic Profiler attribute build using PostSharp would be something like this:
using System;
using PostSharp.Aspects;
using StackExchange.Profiling;

[Serializable]
[AttributeUsage(AttributeTargets.Method)]
public sealed class ProfilerAttribute : OnMethodBoundaryAspect
{
    public override void OnEntry(MethodExecutionArgs args)
    {
        var profiler = MiniProfiler.Current;
        var profilerStep = profiler.Step(args.Method.Name);
        args.MethodExecutionTag = profilerStep;
        base.OnEntry(args);
    }

    public override void OnExit(MethodExecutionArgs args)
    {
        var profilerStep = args.MethodExecutionTag as IDisposable;
        if (null != profilerStep)
        {
            profilerStep.Dispose();
            profilerStep = null;
        }

        base.OnExit(args);
    }
}
That is all. Now you can decorate your controller's action method (or any other method) with [Profiler] attribute to start profiling it. This attribute can only be used for decorating methods because of the attribute usage specified as [AttributeUsage(AttributeTargets.Method)]. You can modify AttributeUsage mode to use it on other targets.
I am capturing profilerStep instance to MethodExecutionTag (OnMethodBoundaryAspect's state object in simple words) in OnEntry and when OnExit is called I dispose the instance.
{<2>}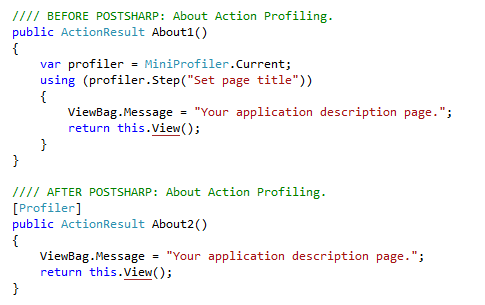
Note: I am solely expressing my own opinions and sharing my experiences and I do not speak for or am not affiliated with MiniProfiler and / or PostSharp team.
Happy coding !!